
- Видео 6
- Просмотров 92 487
Diana Smith
Добавлен 3 мар 2008
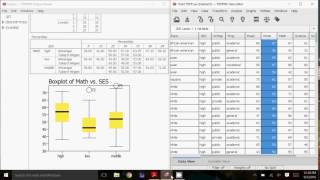
PSPP: Linear Regression and Chi Square Test of Association
Using scatterplots, correlation, regression, and the chi-square test of association in PSPP.
Просмотров: 7 747
Видео


PSPP: One-Sample t-Tests and Proportions
Просмотров 4,4 тыс.7 лет назад
Using one-sample t-tests and testing proportions on PSPP.

PSPP: Two-Sample t-Tests and ANOVA
Просмотров 9 тыс.7 лет назад
Using the independent samples t-test and ANOVA with posthoc comparisons in PSPP.

PSPP: Fisher's Exact Test: Comparing Proportions
Просмотров 2,7 тыс.7 лет назад
Using PSPP to use Fisher's Exact Test when comparing proportions, given the raw data.
PSPP: Descriptive Statistics
Просмотров 35 тыс.7 лет назад
Descriptive statistics, including percentiles and boxplots, on PSPP

I only have 19 data, why do i get a fisher's result of 1?
Hi my version has no graph
Hey, I am doing the exact steps you are doing as well, however The Fishers test does not show up for me
Me too
Can we use PSPP to calculate Covariance of two variables?
hello, how i can delete the outliers in the box?? thks
شكرا
لله يبيض وجهش
I can't see anything
Thanks for this excellent video!!!
when transforming gender into gender1, I don't get any values (0 or 1). the output is just a dot. also "female" is written as "femal in the data viewer - any suggestions
Once you detect the outliers you have to remove them manually in case you want to perform a statistical analysis?
I have installed PSPP and I want to change the language from polish to English. please let me know?
The sound is really poor. Unauditable
Thanks for this video. Can we run descriptive discriminant analysis (DDA) or MANOVAs in PSPP?
I am trying to import csv file i am getting the error of no such file or directory! any solution?
Hello Ms. Diana, If I have around 50 statements based on likert scale, do i need to enter value label for every statement? or can i paste same value labels for other statements? if I can copy, how to do that? Could you please tell me.. I have a questionnaire with 84 statements from Strongly disagree to Strongly agree.. typing the same thing is very tedious work..
is there any way to copy the the variables list?
Can I connect PostgeSQL data with PSPP?
can you give me datas.. needs exercise
How you calculate proportion is .5 And how can we calculate error ratio for check table colom which we see for hypothesis
wow Diana this was pretty usefull , do upload more .
Ma'am, thanks for the video. Can we compute two way Anova in PSPP?
I would like to know this too
Hie Diana..thanks. You are a star. You gave me a good start
Hi diana, thank you for the video. However when I followed step by step on importing data file (.csv) and clicked next, a blank page appeared 😔
can I use pspp in Data Mining o Data Science=?
Thank you for this video, I am doing research on construction field, can I contact you and get your consultancy?
HI Diana, Your video is very much informative...... regards,
how do you export the actual charts? I export and it only shows the info on the left of the output window.
Thanks a lot.
Hi Diana, have you done a video on how to recode categorical variables?
Hi, thank you for making the turorial. Is it possible to get the link to the file you used in the example?
www.openintro.org/stat/extras.php This website has a free stats book and data sets. The data set I used is hsb2.cvs from chapter 5.
Thanks Dian for the link, much appreaciated ;)